Baseball Analytics Project#
An end to end project of scraping data from an existing source, cleaning it, and publishing it in an accessible dashboard.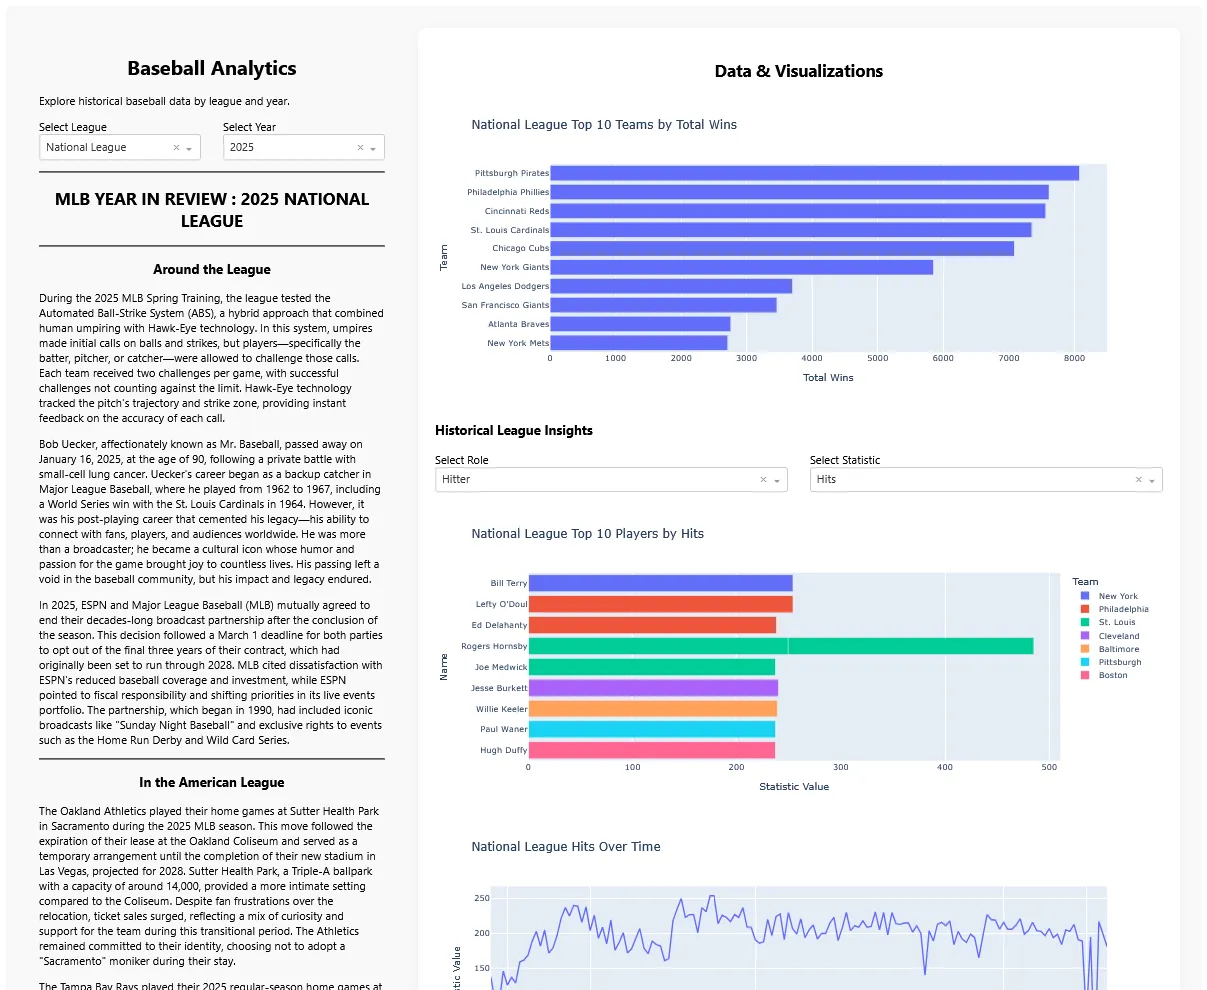
Project Links: Project WebsiteGithub Repository
About the Project#
This project scrapes historical baseball data from league pages, stores it in structured CSV and JSON formats, and provides a command-line interface for querying and analyzing the data via SQLite. The original source of the data is the Baseball Almanac ↗ website. It is pretty basic and data heavy but a pain to navigate or query. I built this project to make it easier to access and analyze the data.
This project is built for people who like their baseball stats clean, queryable, and not buried in HTML spaghetti.
Architecture Overview#
The project is organized into 6 main parts.
- Scraping: Contains all logic for extracting data from the web using Selenium.
- Storage: Responsible for exporting scraped data into structured CSV and JSON files..
- Analysis: It stores the data in SQLite for easy querying and analysis.
- Data: JSON, CSV, and SQLite files are stored in the
data/directory . - Queries: users can write custom SQL queries to analyze the data using the CLI.
- Visualisation: Dash and Plotly are used for visualizing the insights gained from the analysis phase.
Scrapping#
Contains all logic for extracting data from the web using Selenium. It parses HTML tables, normalizes unstructured headers, and handles quirks like division banners and malformed rows which are common in the website.
The scraper.py script is responsible for collecting baseball data from external source (https://www.baseball-almanac.com/ ↗), transforming it into structured formats, and saving it locally for analysis.
The main logic of scraping comes from the scrape_all.py file which calls the driver_setup.py module. Driver setup handles all driver logic to make it modular. We then call the scrape_links module to get the latest page links to populate the years the leagues where active. We finally scrape all years by calling the scrape_year.py file to scrape the final details. We allow a cache file to be passed to avoid re-scraping the same pages unnecessarily. This speeds up the process significantly. We also store the scraped data in JSON and CSV for easy access.
The data within the baseball alamnac website is very messy. Many column names are abbreviated. Many column names exist in multiple shapes such as Team(s), Team [Click for roster], Team | Roster , Team | Roster], TEAM all referring to the Team column name. As such we need to have a dictionary to translate the representation of data in the website into predictable formats for our usage. We make the header_map.py file to store these alternative ways of referring to columns.
Each page of the website has an intro section with some h1 and h2 tags, a quote section, and some data table sections. Each table has its own potentially different convoluted mess of a html with a typical xpath looking like this for just one element:
/html/body/div[2]/div[2]/div[4]/table/tbody/tr[10]/td[5]/aThese elements sometimes exist and sometimes don’t because a previous row has a class tag like this:
<td rowspan="2" class="datacolBlue middle">
<a href="../pitching/piwins4.shtml" title="YEAR BY YEAR LEADERS FOR WINS">Wins</a>
</td>Thats right. The html has a cell that has an attribute that changes whether a cell in an upcoming row will be present or not. I went through countless time-consuming iterations on these parsing logics and I don’t wish them on my worst enemy.
After parsing the data we store the page data into many dictionaries and pass them to the storage/save_load.py module to save to disk.
Storage#
Responsible for exporting scraped data into structured CSV and JSON files. It also handles header normalization and ensures consistent formatting across seasons and leagues. There are two main files here. save_load.py handles working with json cache in our file system to avoid redownloading the data. The other file is exort_csv.py which handles exporting the data to the csv format once scraping is finished.
Analysis#
This part of the application imports CSVs into a SQLite database and provides a CLI for running queries. It includes schema inference, table creation, and flexible querying. It also contains the pandas dataframes files used for furthur analysis. These pandas dataframes are loaded by the visualisation/data_loader module later to produce a nice looking dashboard.
Data#
All output files live in the /data directory.
/data/csv/ : CSV exports
/data/json/<LeagueName>/<Year>.json : JSON files per league/year
/data/season_data.db : SQLite database
Queries#
This part of the project is meant to facilitate the user generated query scripts to be used with the cli tool to analyse and work with the data.
Visualisation#
This part is responsible for loading, processing, and visualising the insights gained from the analysis phase in a beautiful and interactive Dash frontend.
app.py is the main driver of the logic.
callbacks.py is the data controller.
data_loader.py handles loading the data from various modules in the analysis phase.
layout.py handles displaying all results in the frontend.
What I learned#
I learned a lot about scraping and data cleaning. I also learned how to use Selenium to scrape data from a website. I also learned how to use Dash and streamlit to create a beautiful and interactive frontends . I also learned how to use Python’s argparse module to create a CLI tool.
The whole project could be applied to any other data source. I experimented as much as I could and learned just about anything related to getting data from somewhere and making it ready to showcase. The whole pipeline can be applied to infinite needs and projects, be it commercial, educational, or personal. I learned so many parts of data science in this project that in other projects with different tech stacks I can bring all my knowledge together to fit the new project. It is a great way to learn new technologies and get hands-on experience.
Special thanks to my mentor Eric Thompson for his guidance and support throughout the project. He guided me not only through the project but also helped me learn new things and think about my career path. Thank you Eric! And Thank you for reading my post!